Help & Support
How to configure an Indicator for DEBUG mode
If the support team at Rider Trading Tools requests you to put an indicator in DEBUG mode it’s so we can collect data and analyze problems occurring with the indicator.
| Note: Enabling debug mode will decrease the performance of the indicator. Only enable debugging when required by the support team. And disable debug mode once finished collecting data. |
How to Configure the Indicator for DEBUG mode:
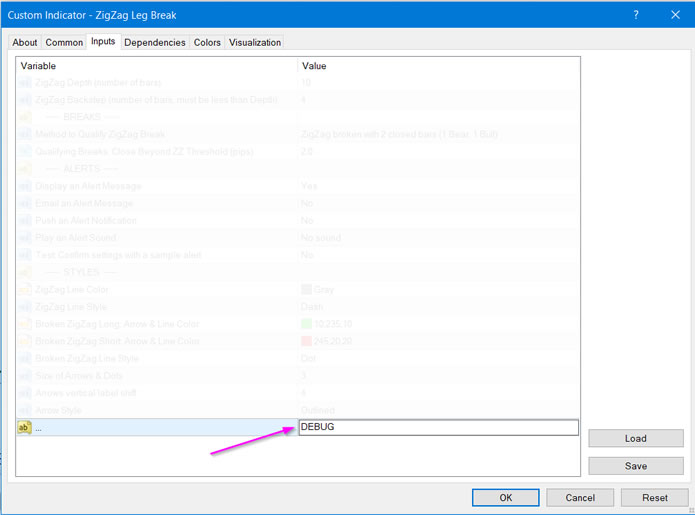
- Open the indicator input parameters (the Inputs tab)
- Edit the last item in the parameters list, which is named …
- Type in the word: DEBUG (note to use all capital letters)
- Then click OK to save the settings.
As you can see in this example screenshot, the ZigZag Leg Break indicator is configured for debugging.

Now the indicator will begin collecting debug data and storing it in a file which can be used by support team for analysis.
Send the Debug file to Rider Trading Tools:
After the problem has been recreated or enough time has past to collect the data, you can locate and email the debug file to support team at Rider Trading Tools.
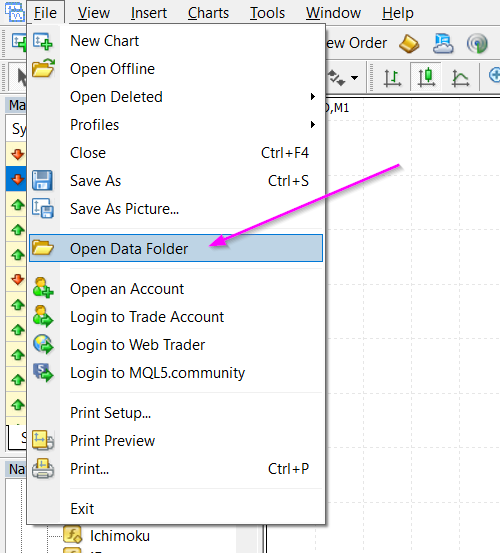
1. Open the MT4 Data Folder. Click File menu. Then click Open Data Folder.

2. After the Windows explorer opens, double-click the MQL4 folder. And then double-click the Files folder.
In the our example above we put the ZigZag Leg Break indicator into Debug mode, so for this example the file would be “ZigZag Leg Break.dblog“

3. For the indicator you have configured debugging, locate it’s .dblog file for that indicator name (for example, “Active Price Lines.dblog” or “Chart Local Time.dblog”, etc.)
4. Send that dblog file to Support@RiderTradingTools.com for analysis.
How to disable the DEBUG mode:
Once finished collecting the debug data it’s important to disable the debug mode.
- Open the indicator input parameters (the Inputs tab)
- Edit the last item in the parameters list, which is named …
- Remove the word DEBUG so the entry field is blank.
- Then click OK to save the settings.
